Sample Rank™ is an algorithm designed to alert you to problematic results which can cause equipment failure. Presence of fuel, water, glycol and/or a spike in particles can trigger a high Sample Rank as there is potential failure occurring.
Your Sample RankTM score ranges from 0 to 10, with higher ranks indicating more abnormal samples. Sample Rank looks over your samples and scores them, letting you focus on the important samples first.
Sample Rank puts your results into context, and tells you what your results mean. You can quickly see how your results compare to the flag limits and typical results, and how they are trending.
Sample Rank is looking out for you, all the time, on every sample. Sample Rank compares your results against a similar set from the over ten million samples we’ve already analyzed, and looks out for results that are off trend based on your equipment’s past results. Our graphic analysis results page displays the results so you can see what’s going on at a glance.
We’re already using Sample Rank when we review your results and we’re always making improvements. We’ll make changes from time to time to include new test results and adjust the scores to always bring your most important results to you at the top of the list, saving you valuable time.
How it works:
For every sample, each result is assigned a Test Rank from three primary factors.
- The percentile of the latest result compared to our histograms of similar samples
- How far off trend the current result is compared to previous results
- The tests flag
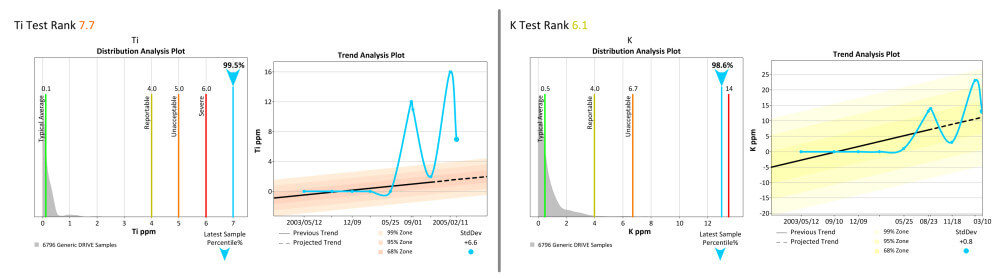
These are shown on your graphical analysis page. The factors are combined to compute the Test Rank such that the highest ranked test will be in the most abnormal percentile range and most off trend. The Test Rank will be higher for a given percentile if the trend is increasing (assuming higher results are worse) and lower if the trend is downward. Once Test Rank has scored all of the results, the top six are found and combined and adjusted based on the worst test flag to form your Sample Rank.
Occasionally, you may see on your latest results that the Test Rank does not match the flag (e.g. flag is red but Test Rank is in 0-5 range and green). The flag only looks at the current sample results one test at a time and not at any trend from previous samples while Sample Rank does consider the trend over time.
Learn more about Sample Rank and Flagging Limits – contact a Fluid Life representative today.