-
myLab
-
Services
-
- Acid Number
- Analytical Ferrography
- Base Number: ASTM D2896 vs. D4739
- Crackle Test: Monitoring Water in Used Oil
- Demulsibility
- FTIR Direct Trend Methodology
- Fuel Distillation (ASTM D86)
- ISO Particle Count
- Karl Fischer Water Titration
- Optical Particle Classification (OPC)
- Remaining Useful Life Evaluation Routine (RULER)
- SEM-EDS Wear Debris Analysis
- Total Magnetic Iron (TMI)
- Varnish Potential
-
-
Sampling
-
- Coolant Sampling Procedures
- Grease Sampling Procedures
- Oil Sampling Basics (Short Course)
- Oil Sampling Procedures (Video)
- Oil Sampling Procedures: Good-Better-Best (PDF)
- Sample Collection Basics
- Sampling Oil Using a Drain Plug
- Sampling Oil Using a Pushbutton or KST-Series Valve
- Sampling Oil Using a Sample Pump
- Sampling Oil Using Thread-On Probe Style Valves
- Used Oil Filter Sampling
- Sampling from Filter Carts
-
-
Data Interpretation
-
- Analytical Ferrography Reporting
- Basic Testing Interpretation (PDF)
- Common Wear Mechanisms (PDF)
- Comparison: Wear Debris Analysis Technologies
- DEF Specifications: ISO 22241
- DEF Testing: Data interpretation
- Oil Cleanliness: ISO vs. NAS
- Potential Source of Spectrometry Metals (PDF)
- Reading the OA Report (PDF)
- Understanding ISO Particle Counts (PDF)
- Wear Metal Origins (PDF)
- Why Diesel Fuel Dilution is Bad for Your Engine
-
- Data Interpretation Process (Video)
- Data Interpretation: Compressors (Video)
- Data Interpretation: Diesel Engines (Video)
- Data Interpretation: Grease Analysis for Wind Turbines (VIDEO)
- Data Interpretation: Hydraulics (Video)
- Data Interpretation: Natural Gas Engines (Video)
- Data Interpretation: Oil Analysis for Wind Turbines (Video)
- Data Interpretation: Reducers (Video)
- Data Interpretation: Turbines (Video)
-
-
Whitepapers
-
Success Stories
- Case Study: Early Detection of Bearing Wear
- Rapid Nitrite Depletion in Modern Excavator Cooling Systems: Causes and Solutions
- Unlocking Millions in Maintenance Cost Savings
- Strategic Optimization of Oil Drain Intervals
- The Case for Building Strong Partnerships
- Case Study: Extended Drain Interval
- CARE & Oil Analysis for Early Detection of Issues
- Fuel Dilution of Engine Oil in Mining Dozer
- Early Detection of Wear Metals in Gearbox
- Coolant Contamination in Dozer Engine Oil
- Case Study: The Right Test Slate for the Correct Failure Mode
-
FAQ
-
Release Notes
< All Topics
Print
Homepage Charts
Posted
Updated
ByFluid Life
Three charts are available on the homepage which highlight key KPIs for your program: In Service Units Sampled, Ranked Samples, and Transit Time.
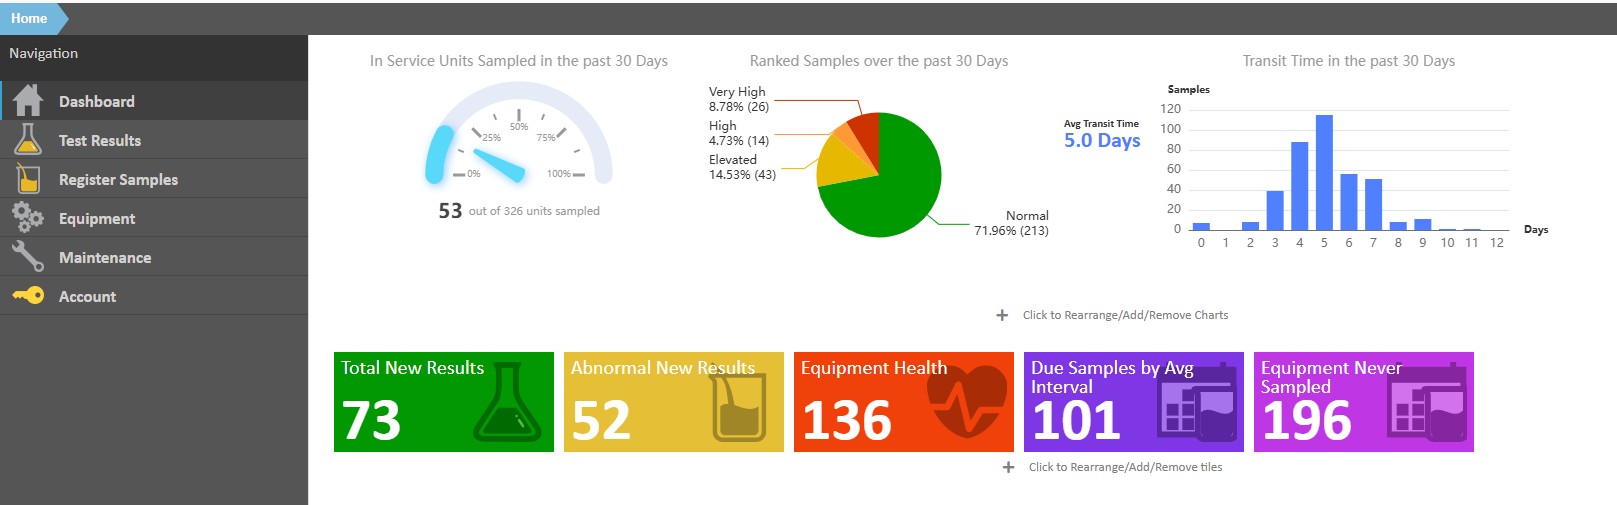
Chart Management
- The chart time period defaults to 30 days but can be changed in each User’s preferences.
- These charts can be hidden or displayed in the same fashion as the tiles on the home page (select the “Click to Rearrange/Add/Remove Charts” button under the charts to modify your view).
- This section can be collapsed by clicking on the small black arrow to the right of the screen.
Video Overview
Available Charts
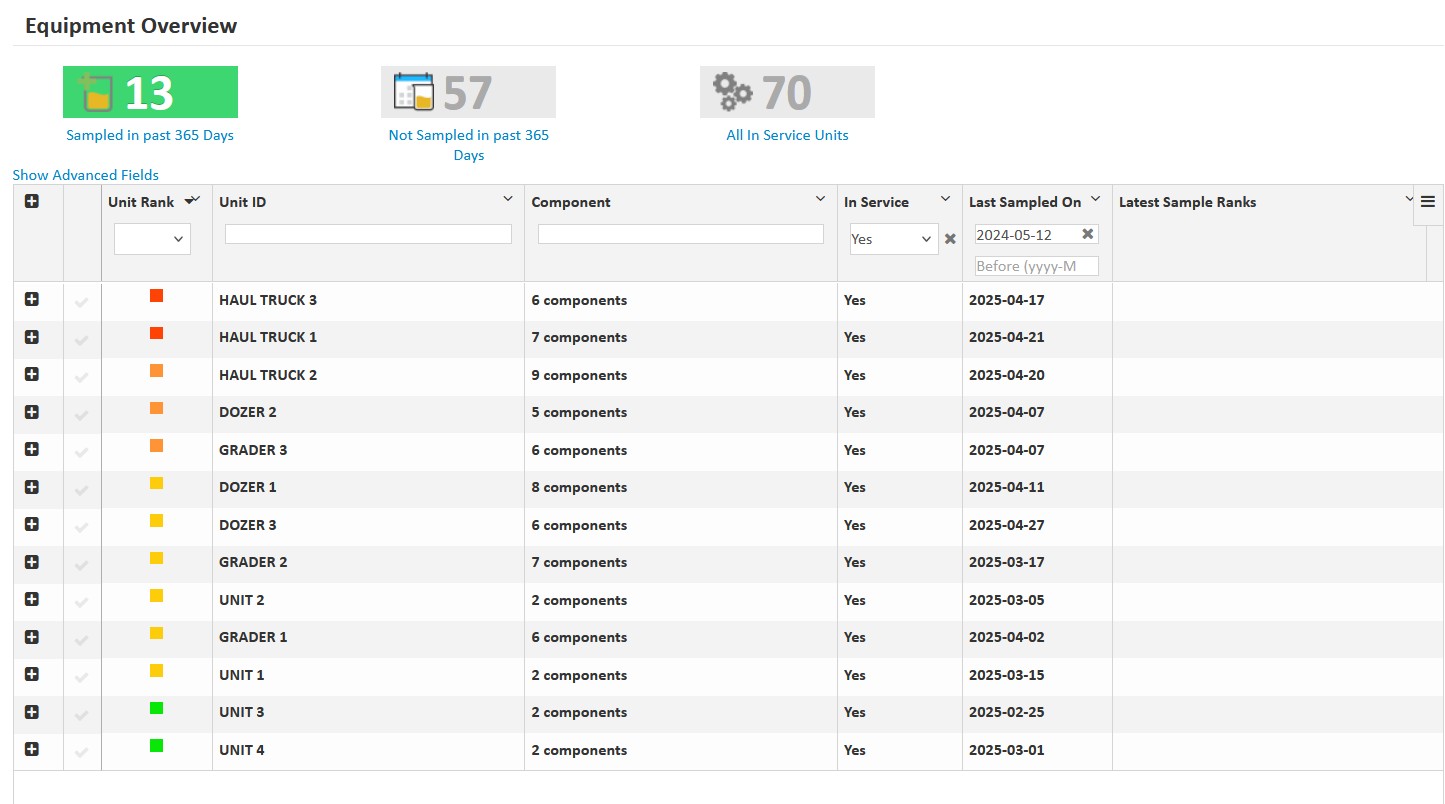
- In-Service Units Sampled Over the past X days – This chart shows the percentage of units sampled over the time period indicated and can highlight if there’s an issue with compliance or the equipment database (units in service). Clicking on this chart will take you to the new “Equipment Overview” page (Register Samples>>Equipment Overview).
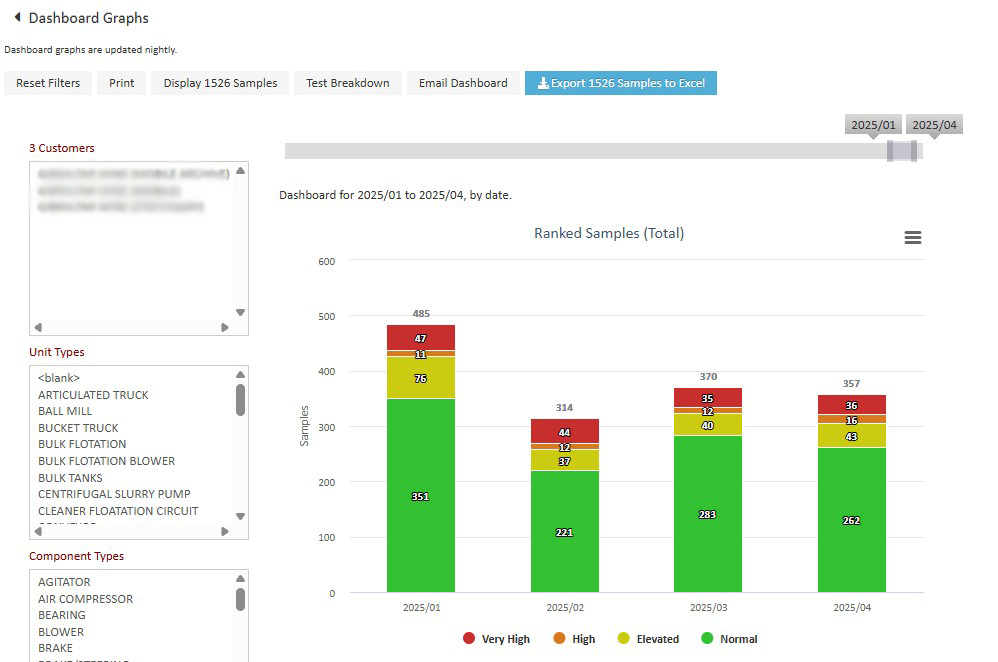
- Ranked Samples over the past X days – This chart shows the percentage of samples that are normal compared to those with issues. Clicking on this graph will take you to the Dashboard Graphs page where you can adjust the view to monitor trends and also drill down to the customer/location, units, and components.
- Transit Time in the past X days – This chart shows the average transit time (time from sample registration to arrival/set up in lab) and the distribution of samples based on number of transit days. You can easily see if there is an issue with transit time in order to follow up with shipping protocols (e.g. samples waiting for consolidation, courier issues, samples left on site). Clicking on this chart takes you to the Dashboard Graphs page where you can review turnaround in more detail, drilling down to the customer/location, unit, and component types.
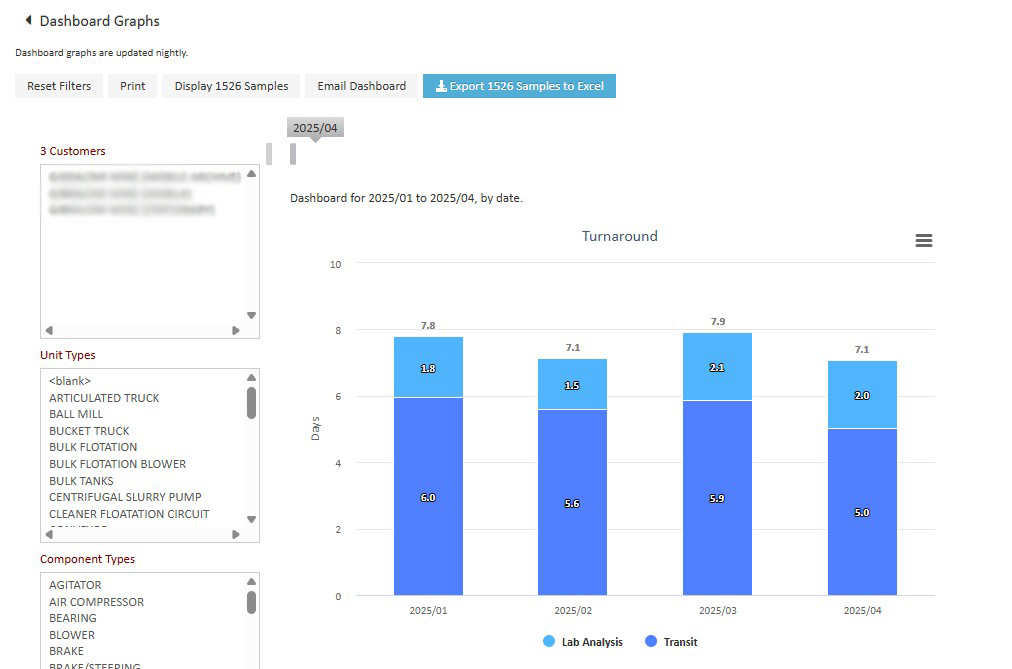
Table of Contents