Reviewing Results
Review New Results
The Review New Results window offers users an at-a-glance overview of all the recent, unacknowledged samples with the ability to sort through all the samples based on the severity of the result.
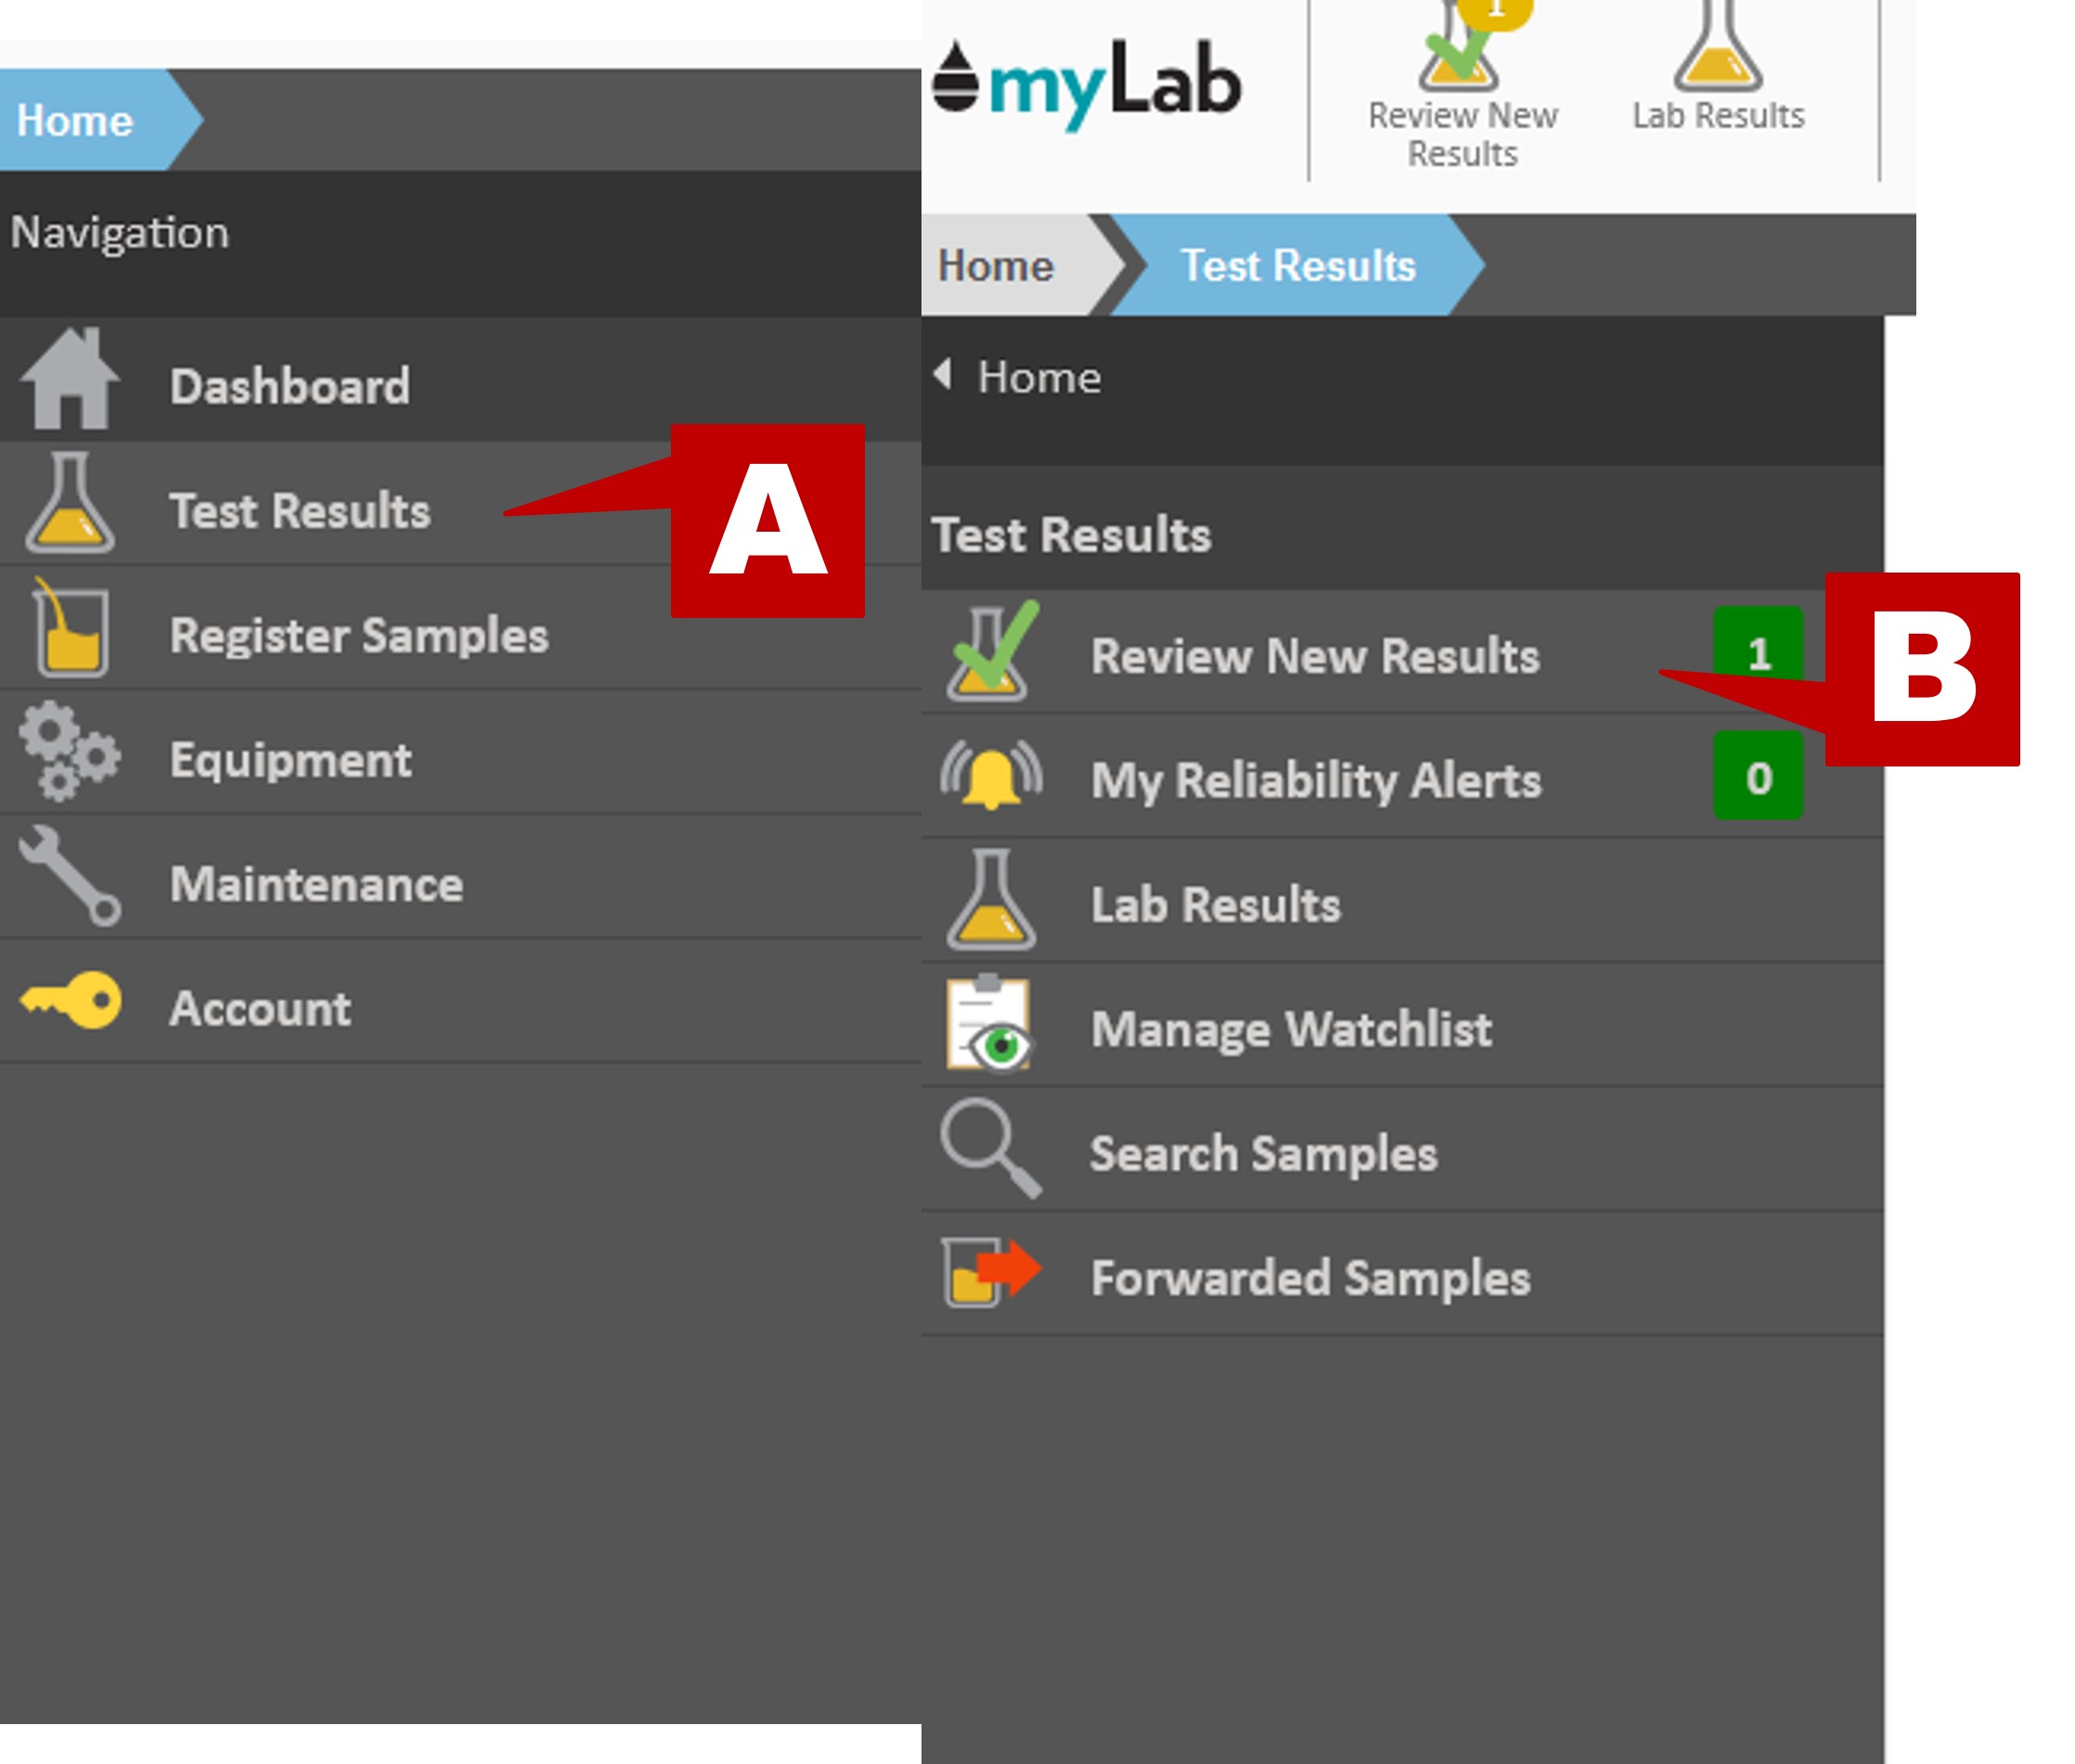
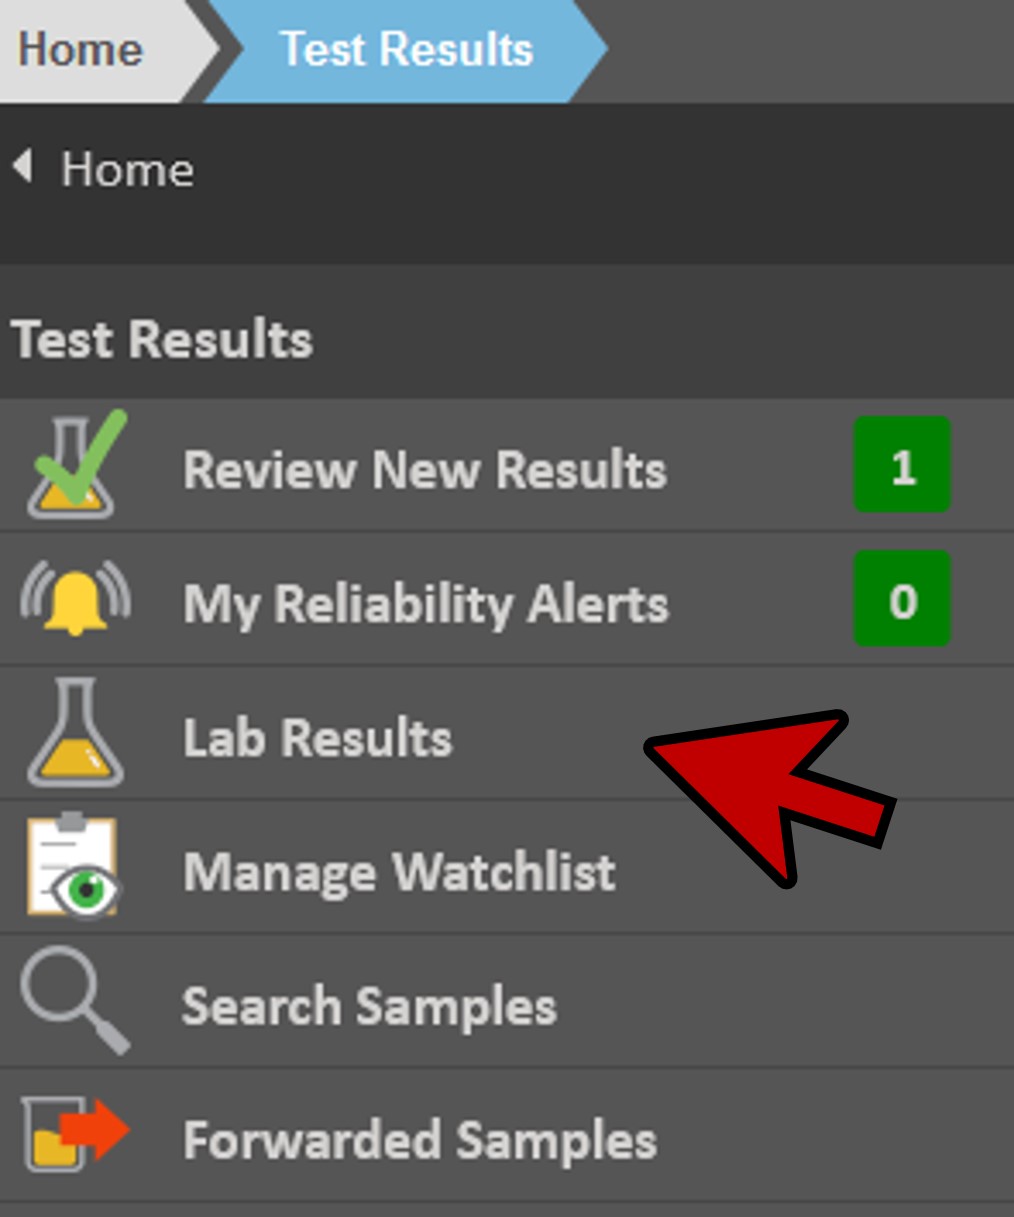
- CLICK Test Results (A) on the left navigation, then Review New Results (B) to open the Unacknowledged Samples window.
- A list of the most recent unacknowledged samples is shown in descending Sample Rank order.
- This order may be changed by clicking the Order By: drop list located in the bottom left-hand corner of the window.
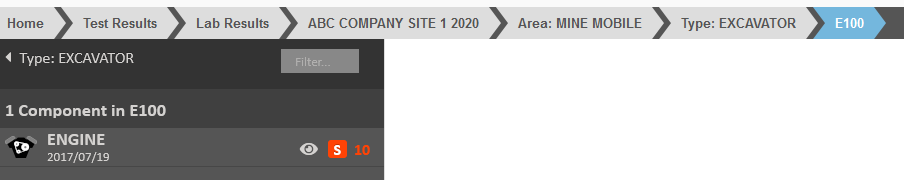
- The columns for each sample indicate the following:
- Eye icon – result is on a watchlist
- Oil can icon – indicates oil changed
- S / U / R / N ranking – Severe / Unacceptable / Reportable / Normal
- Number – this is the Sample Rank for the sample
- C – Contaminants diagnostic
- O – Oil (or fluid) condition diagnostic
- W – Wear Indicators diagnostic
- The icons under the C, O, and W columns indicate the severity of the issue (Critical / Caution / Normal) and allow for a quick view to any possible issues based on the three key diagnostics.
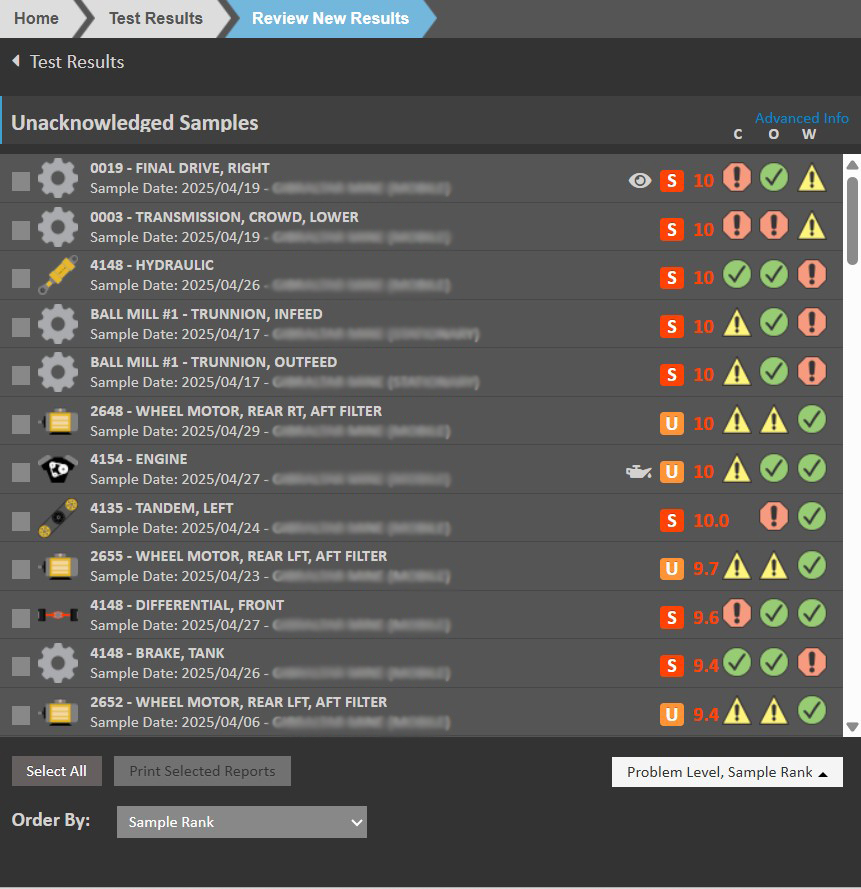
- If a sample did not have any testing done which applies to the C, O, or W diagnostic, the space is left blank.
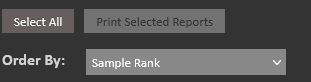
- The Order By at the bottom of the screen will allow you to order the samples by a number of different options such as Sample Rank, Contamination, Watch List, etc.
- Also below the sample list is a drop down list which allows you to hide the Sample Rank, Problem Level, or the diagnostics from the listing.
- The results may also be filtered by the filters that automatically appear on the right-hand side of the window (underneath the summary).
- For the C, O, and W diagnostics, there are quick filters for “Caution” and “Critical” that will filter out the samples to only show those with the selected severities.
- You can click on Additional Filters to filter your samples using many different criteria. (Sample Date, Sample Rank, Unit Area, Component Manufacturer are just a few ways).
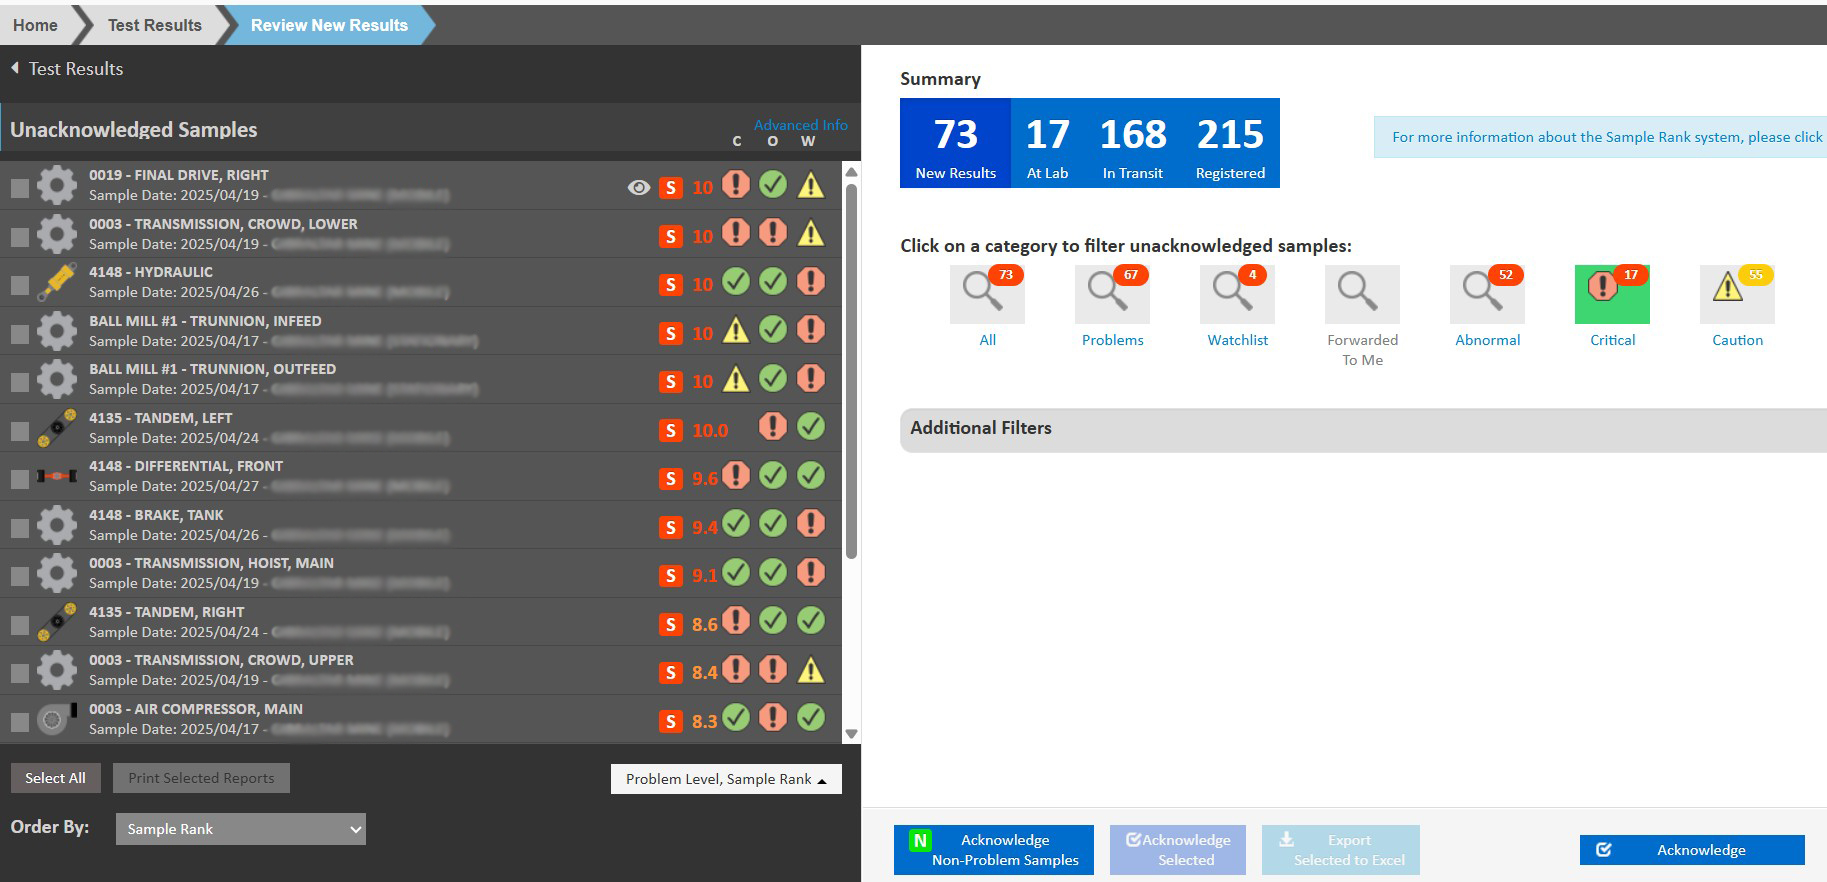
- The buttons at the bottom of the window allow the user to either: Acknowledge all Samples, Acknowledge Non-Problem Samples, manually Acknowledge Selected samples, and Export Selected to Excel.
- Results older than 3 months are automatically acknowledged.

- *Note: You will notice that there are two boxes greyed out. If you check off one of the boxes to the left of your Unacknowledged Samples the two boxes will become available.
- Like the following.

- CLICK Home
Sample Diagnostics
This video provides an overview of the sample diagnostics available on reports and the test results summary.
Viewing Oil Sample Results
- From the Home page, select Test Results, then Lab Results to open the Oil Sample Results window.
- Select the company from the Customers list. Select from the Unit Areas list, Unit Types list, Units list and Components list. At this point the latest results will open.
- You can also access individual sample results from the Review New Results page by clicking on the individual samples.
- On the Sample Review page, the page-wide Sample Rank bar has been removed and replaced with a more useful sample summary section. The left side indicates the Sample Rank number and the severity level of each Diagnostic (Contamination, Oil/Fluid Condition and Wear Indicators).
- Recommended Actions and Results for the selected sample will display on the left side.
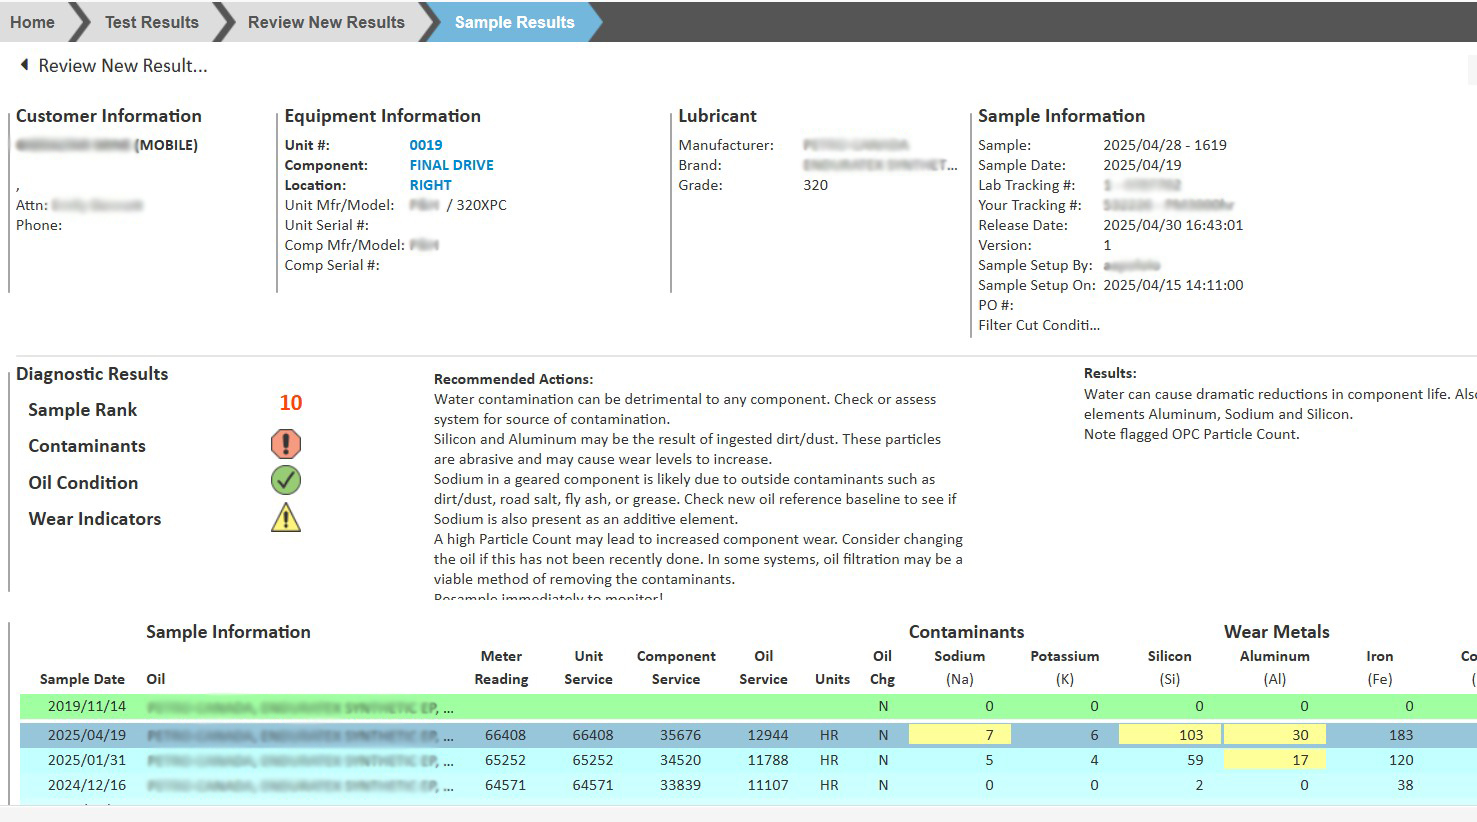
- Using the scroll bars, move up/down and left/right through the oil analysis data.
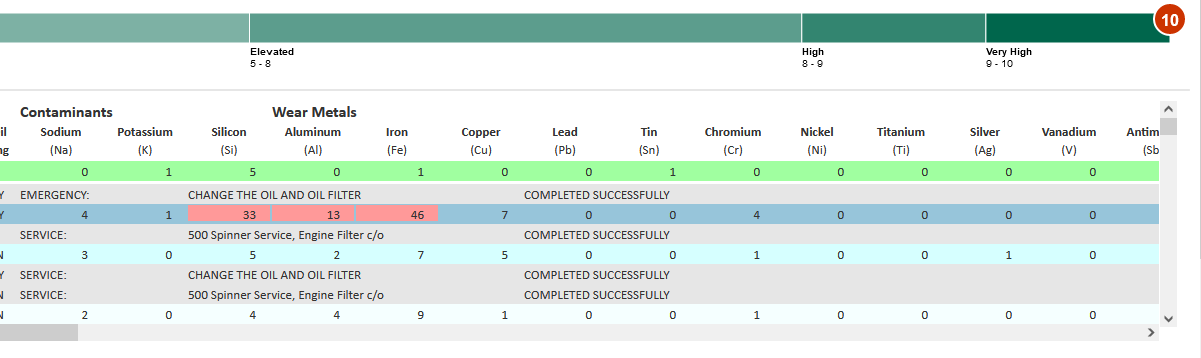
- CLICK on a cell within any of the rows shown on screen. A distribution analysis graph will pop up so you can view now this sample compares to previous samples. Note: Sample Rank will change corresponding to the given sample date, and highlight the applicable Results and Recommendations.
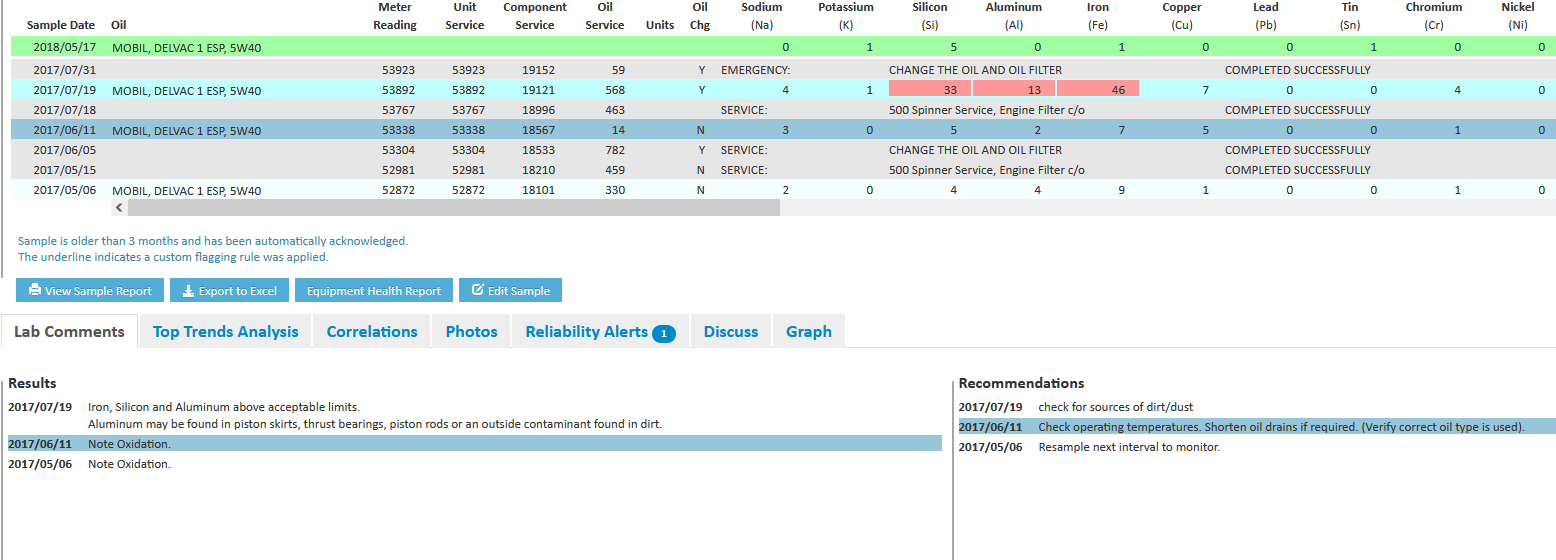
The Sample Rank is a combination of the top six Test Ranks. Individual Test Ranks are based on two primary factors: First is the percentile of the latest result compared to our histograms of similar samples. The second is how far off trend the current result is compared to previous results for the same piece of equipment. The factors are combined to compute the Test Rank such that the highest ranked test will be the farthest from typical average and most off trend. The Test Rank will be higher for a given percentile if the trend is increasing (assuming higher results are worse) and lower if the trend is downward.
The Lab Comments area includes all of the comments from the lab that would normally be shown in the Results and Recommendations area on the standard printed report.
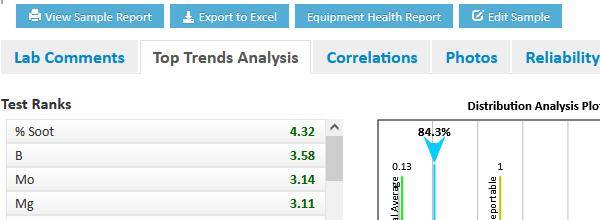
- For any samples showing elevated Sample Rank, CLICK the Top Trends Analysis tab (below the sample results) to see which parameters are driving this result. They will be sorted from highest (10) to lowest (0) Test Rank.
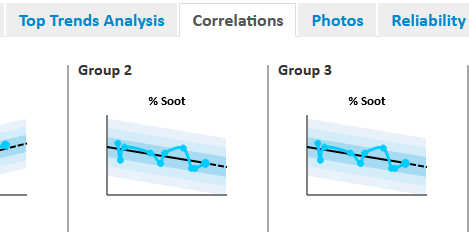
- CLICK on Correlations to view which items trend similarly.
Graph
- CLICK on the Graph tab.
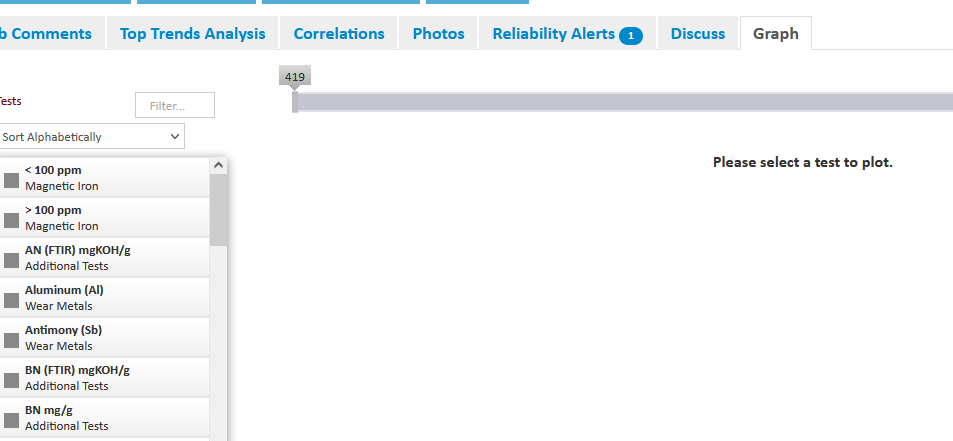
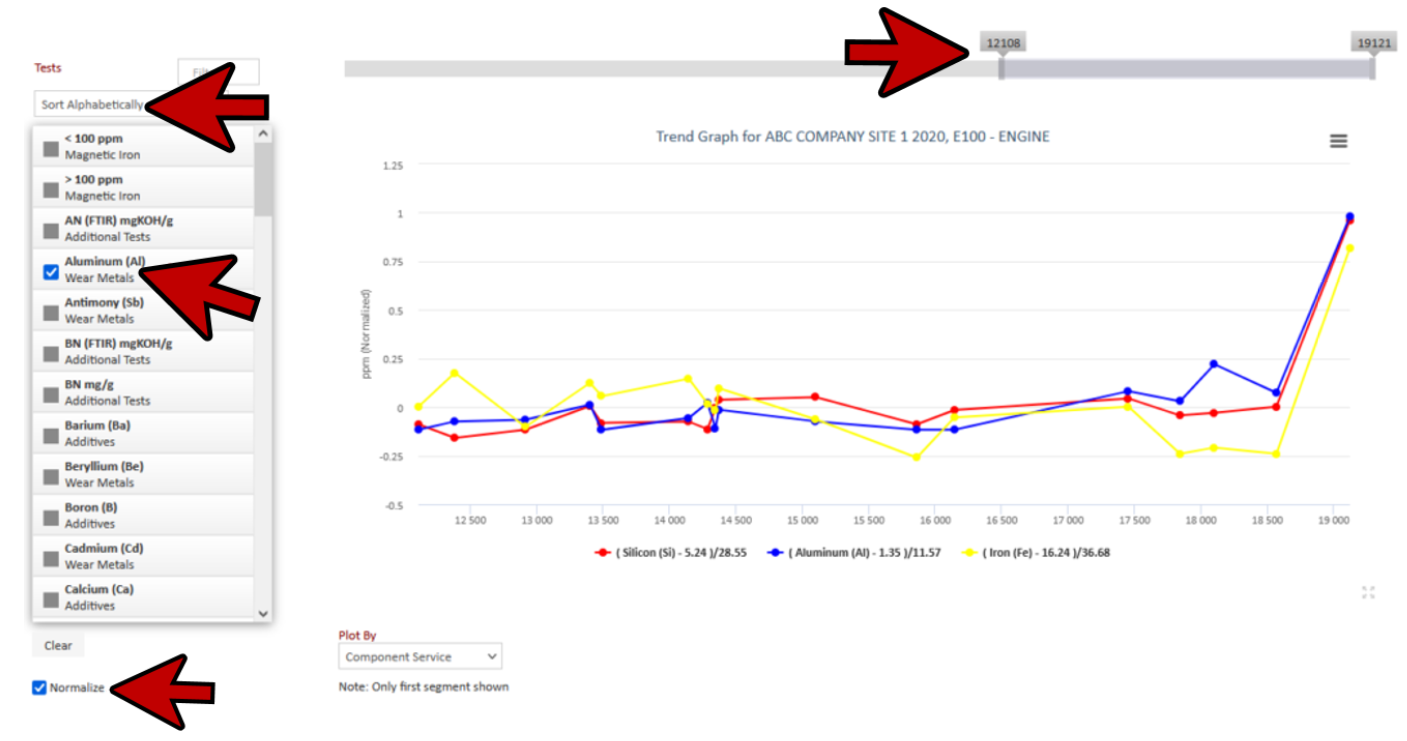
- Under the Graph tab you can select items either by Alphabetically or by Test Group. SELECT Alphabetically.
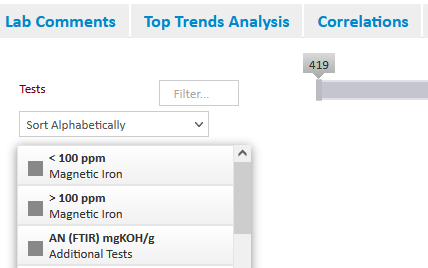
- Select the items you want to graph.
- Check off Normalize.
- You can Plot By: Component Service, Sample Date, Meter Reading, Unit Service and Oil Service.
- You can then adjust the sample range to reflect the time frame or unit of measure selected in the Plot By field.
Edit Sample Data
myLab users do not have the ability to change oil analysis results; however users can change some of the information provided to the lab during the sample setup (i.e. Oil Hours, Oil Type, etc.).
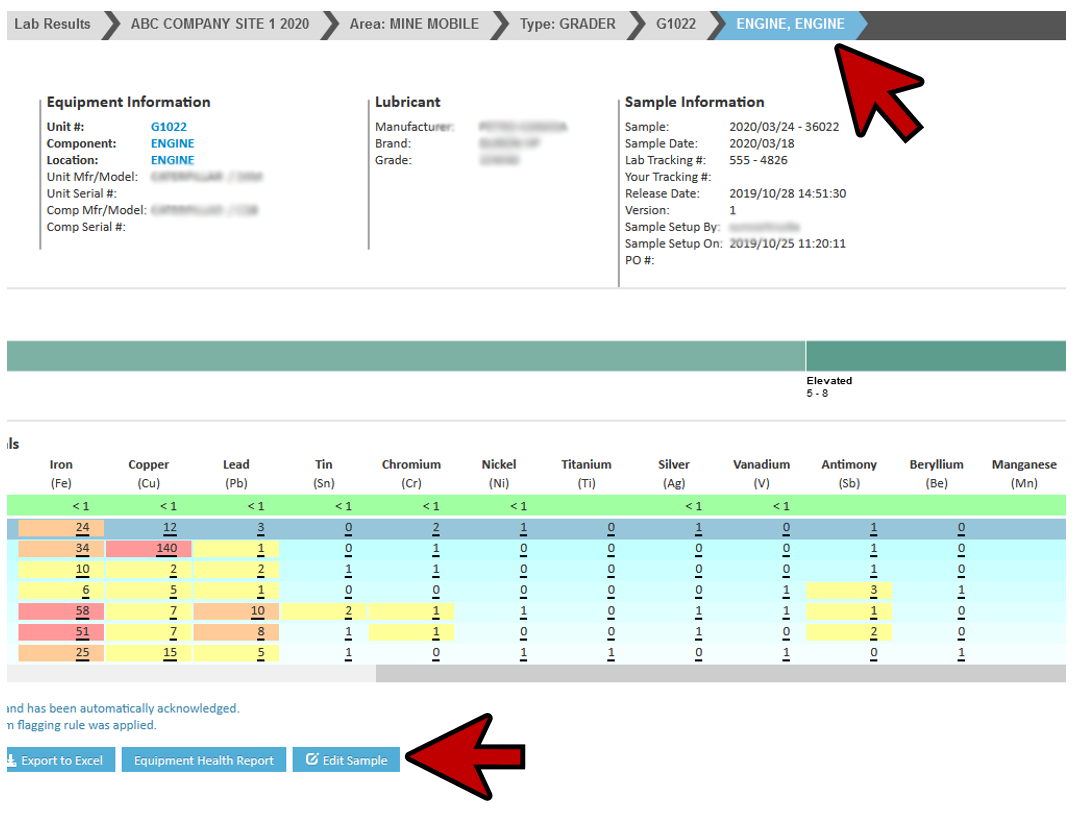
- Open the latest oil analysis results window for the following Unit Area, Unit Type, Unit and Component.
- CLICK Edit Sample to open the Edit Sample window.
- CLICK the ‘Chg‘ checkbox to ADD the check mark (meaning the oil was changed). You can also see that you can make changes to the hours, oil type as well as add Notes.
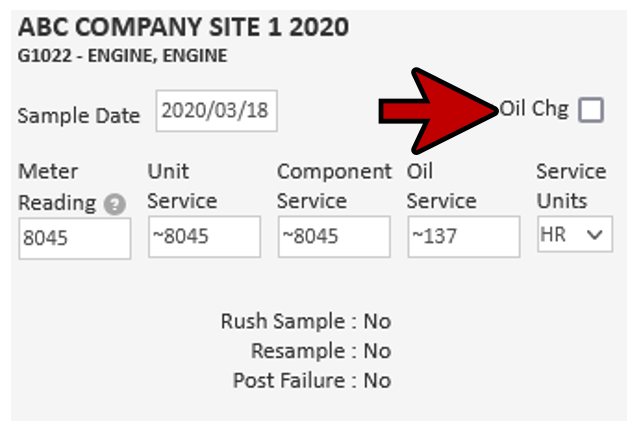
- CLICK Save at the bottom
- CLICK Home to return to the Home page.
Viewing Photos
- CLICK the Photos tab. Sample results including pictures (ISO, Sediment or Ferrography) will be shown here.
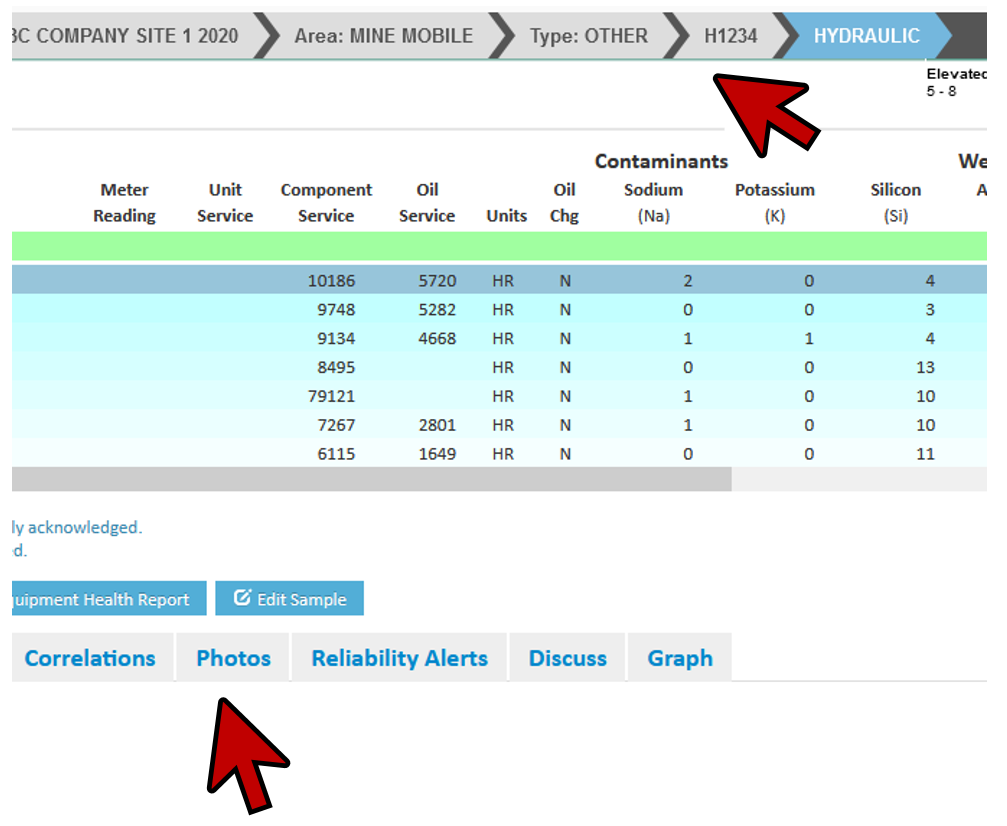
- CLICK on the picture to enlarge.
- The Image window includes three tools for helping to review the picture.
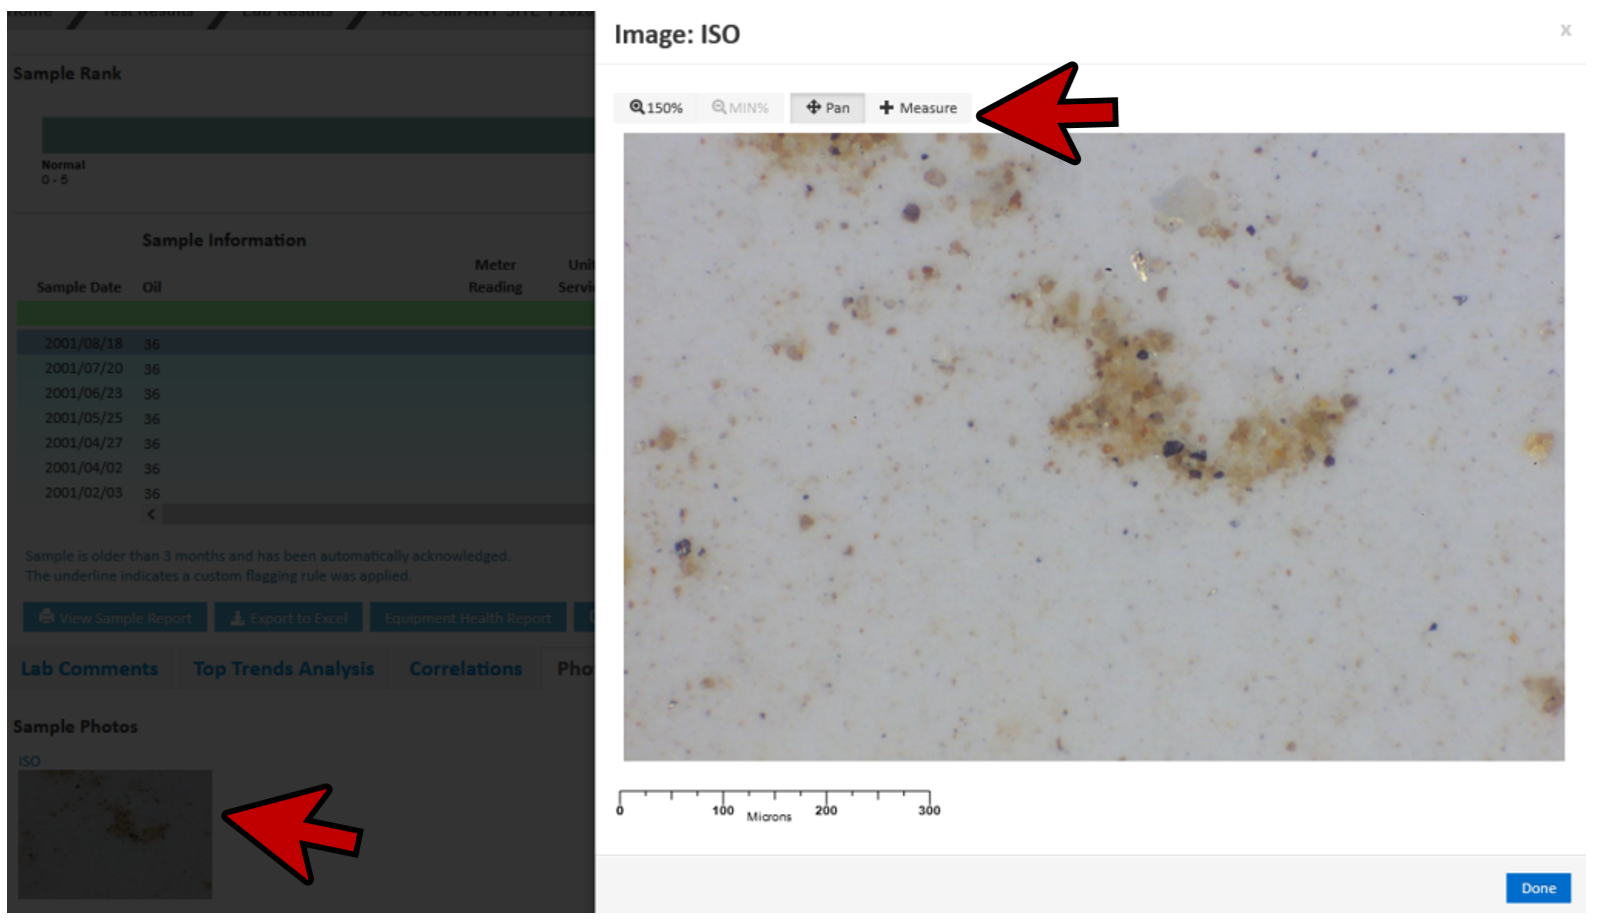
- Select desired zoom level using the buttons at the top-left of the window.
- CLICK the (middle) Pan button.
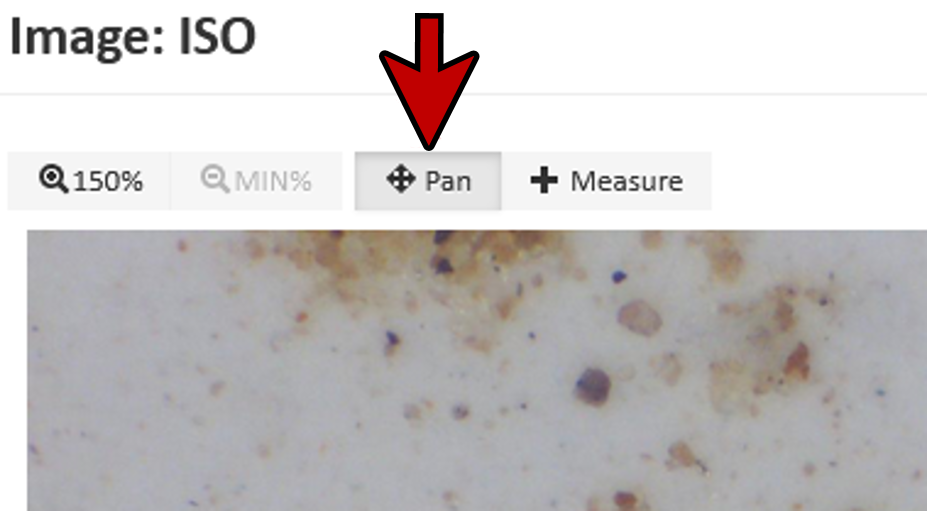
- CLICK and hold the cursor (changed to crossed arrows) in the center of the picture and then move the mouse around to scroll around the picture.
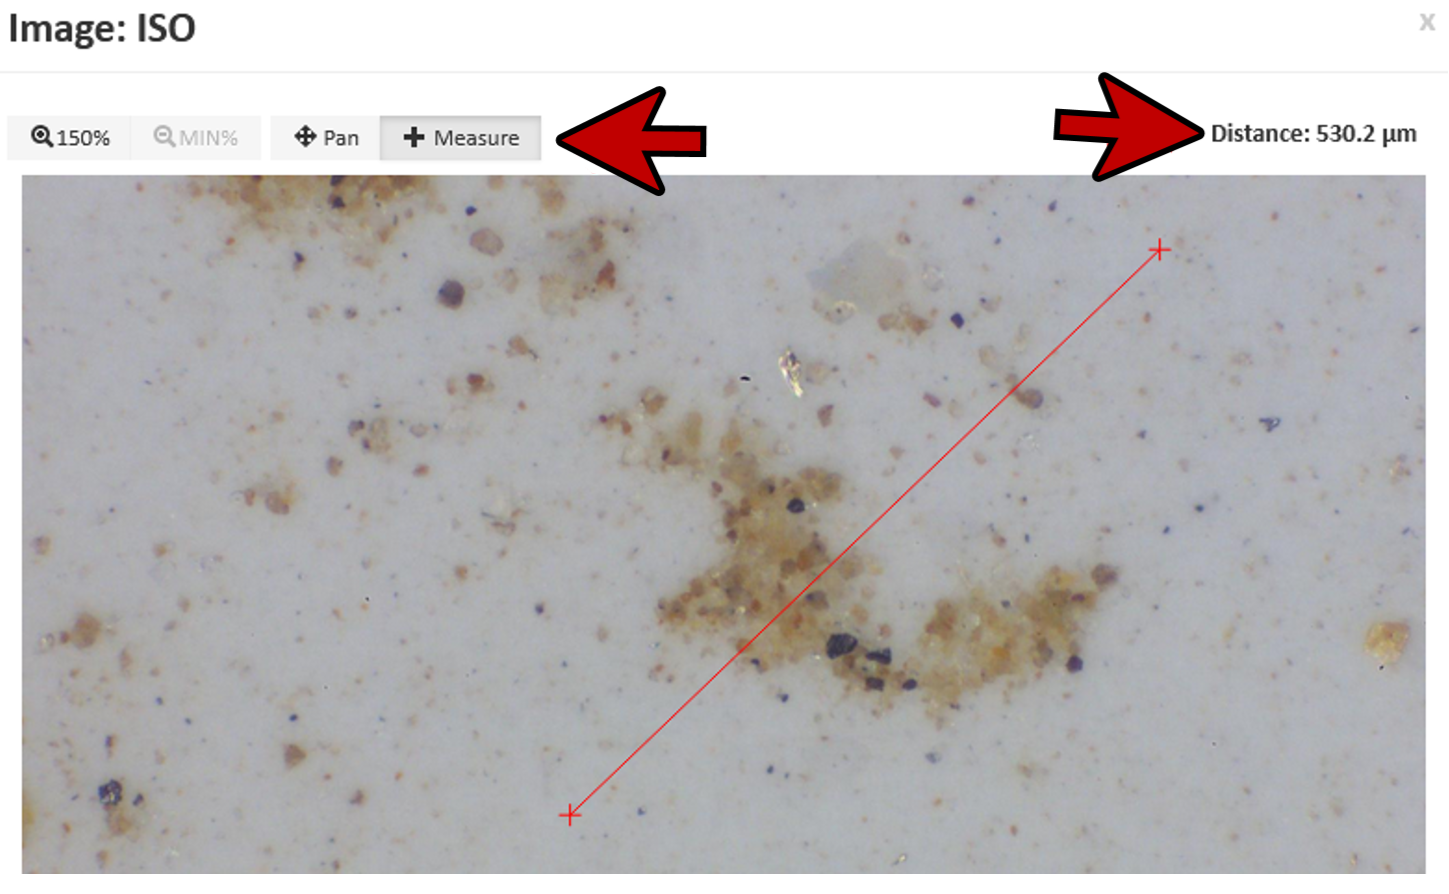
- CLICK the right-hand button (Measure).
- In the photo CLICK, hold and drag. While dragging, the distance will be displayed in the top right-hand corner. This function is useful for determining the size of large particles.
- Close the photo (CLICK Done or the x).
- CLICK Home to return to the Home page.