FTIR Direct Trend Methodology
Overview
There are two main types of Fourier Transform Infrared (FTIR) spectroscopy methods designed to look at new oils: Direct Trend (non-differential) and Differential (used oil minus new oil), also known as the Spectral Subtraction method.
| Direct Trend | Spectral Subtraction |
| New Oil identification is not required Trend plotting is used to monitor oil degradation Typical warning levels are applied as a difference from the new oil No interferences from top-ups or different new oils Peak Area | Designed only for samples with 100% known oils Easy to set alarm limits Easy to interpret Top-ups confuse the results Very easy to assign the wrong oil Need to collect and provide seasonal new oil reference samples every 6 months Peak Height |
As of Q4 2021, Fluid Life no longer offers the Spectral Subtraction methodology for reporting FTIR Oxidation, Nitration and Sulfation. We moved to Direct Trend in response to feedback from our customers and to eliminate the problems associated with Spectral Subtraction.
| Parameter | Current Method | New Method |
| % Soot | ASTM E2412: Calibration | ASTM E2412: Calibration |
| Oxidation | Spectral Subtraction | Direct Trend |
| Sulfation | Spectral Subtraction | Direct Trend |
| Nitration | Spectral Subtraction | Direct Trend |
Known Issues with Spectral Subtraction
Spectral Subtraction requires an up to date FTIR reference for each and every new oil and as a result, it is difficult or impossible for the end user to provide an accurate reference. This situation is further complicated if routine top-ups or seasonal oil changes occur. Bottom line, the new oil spectrum must be accurate otherwise the analysis will produce misleading or incorrect results.
Advantages of Direct Trend FTIR
The Direct Trend methodology eliminates the problems associated with Spectral Subtraction and offers these benefits:
- The exact site, seasonal or geographic new oil references are no longer required.
- Direct trend can facilitate simple to understand standardized flagging limits. Flagging limits can be based on the difference from baseline or a conservative absolute value.
- No interferences from new oil spectra or top offs. You can observe top-ups or changes in chemistry using a trend plot.
Interpretation: Flagging/Alarming
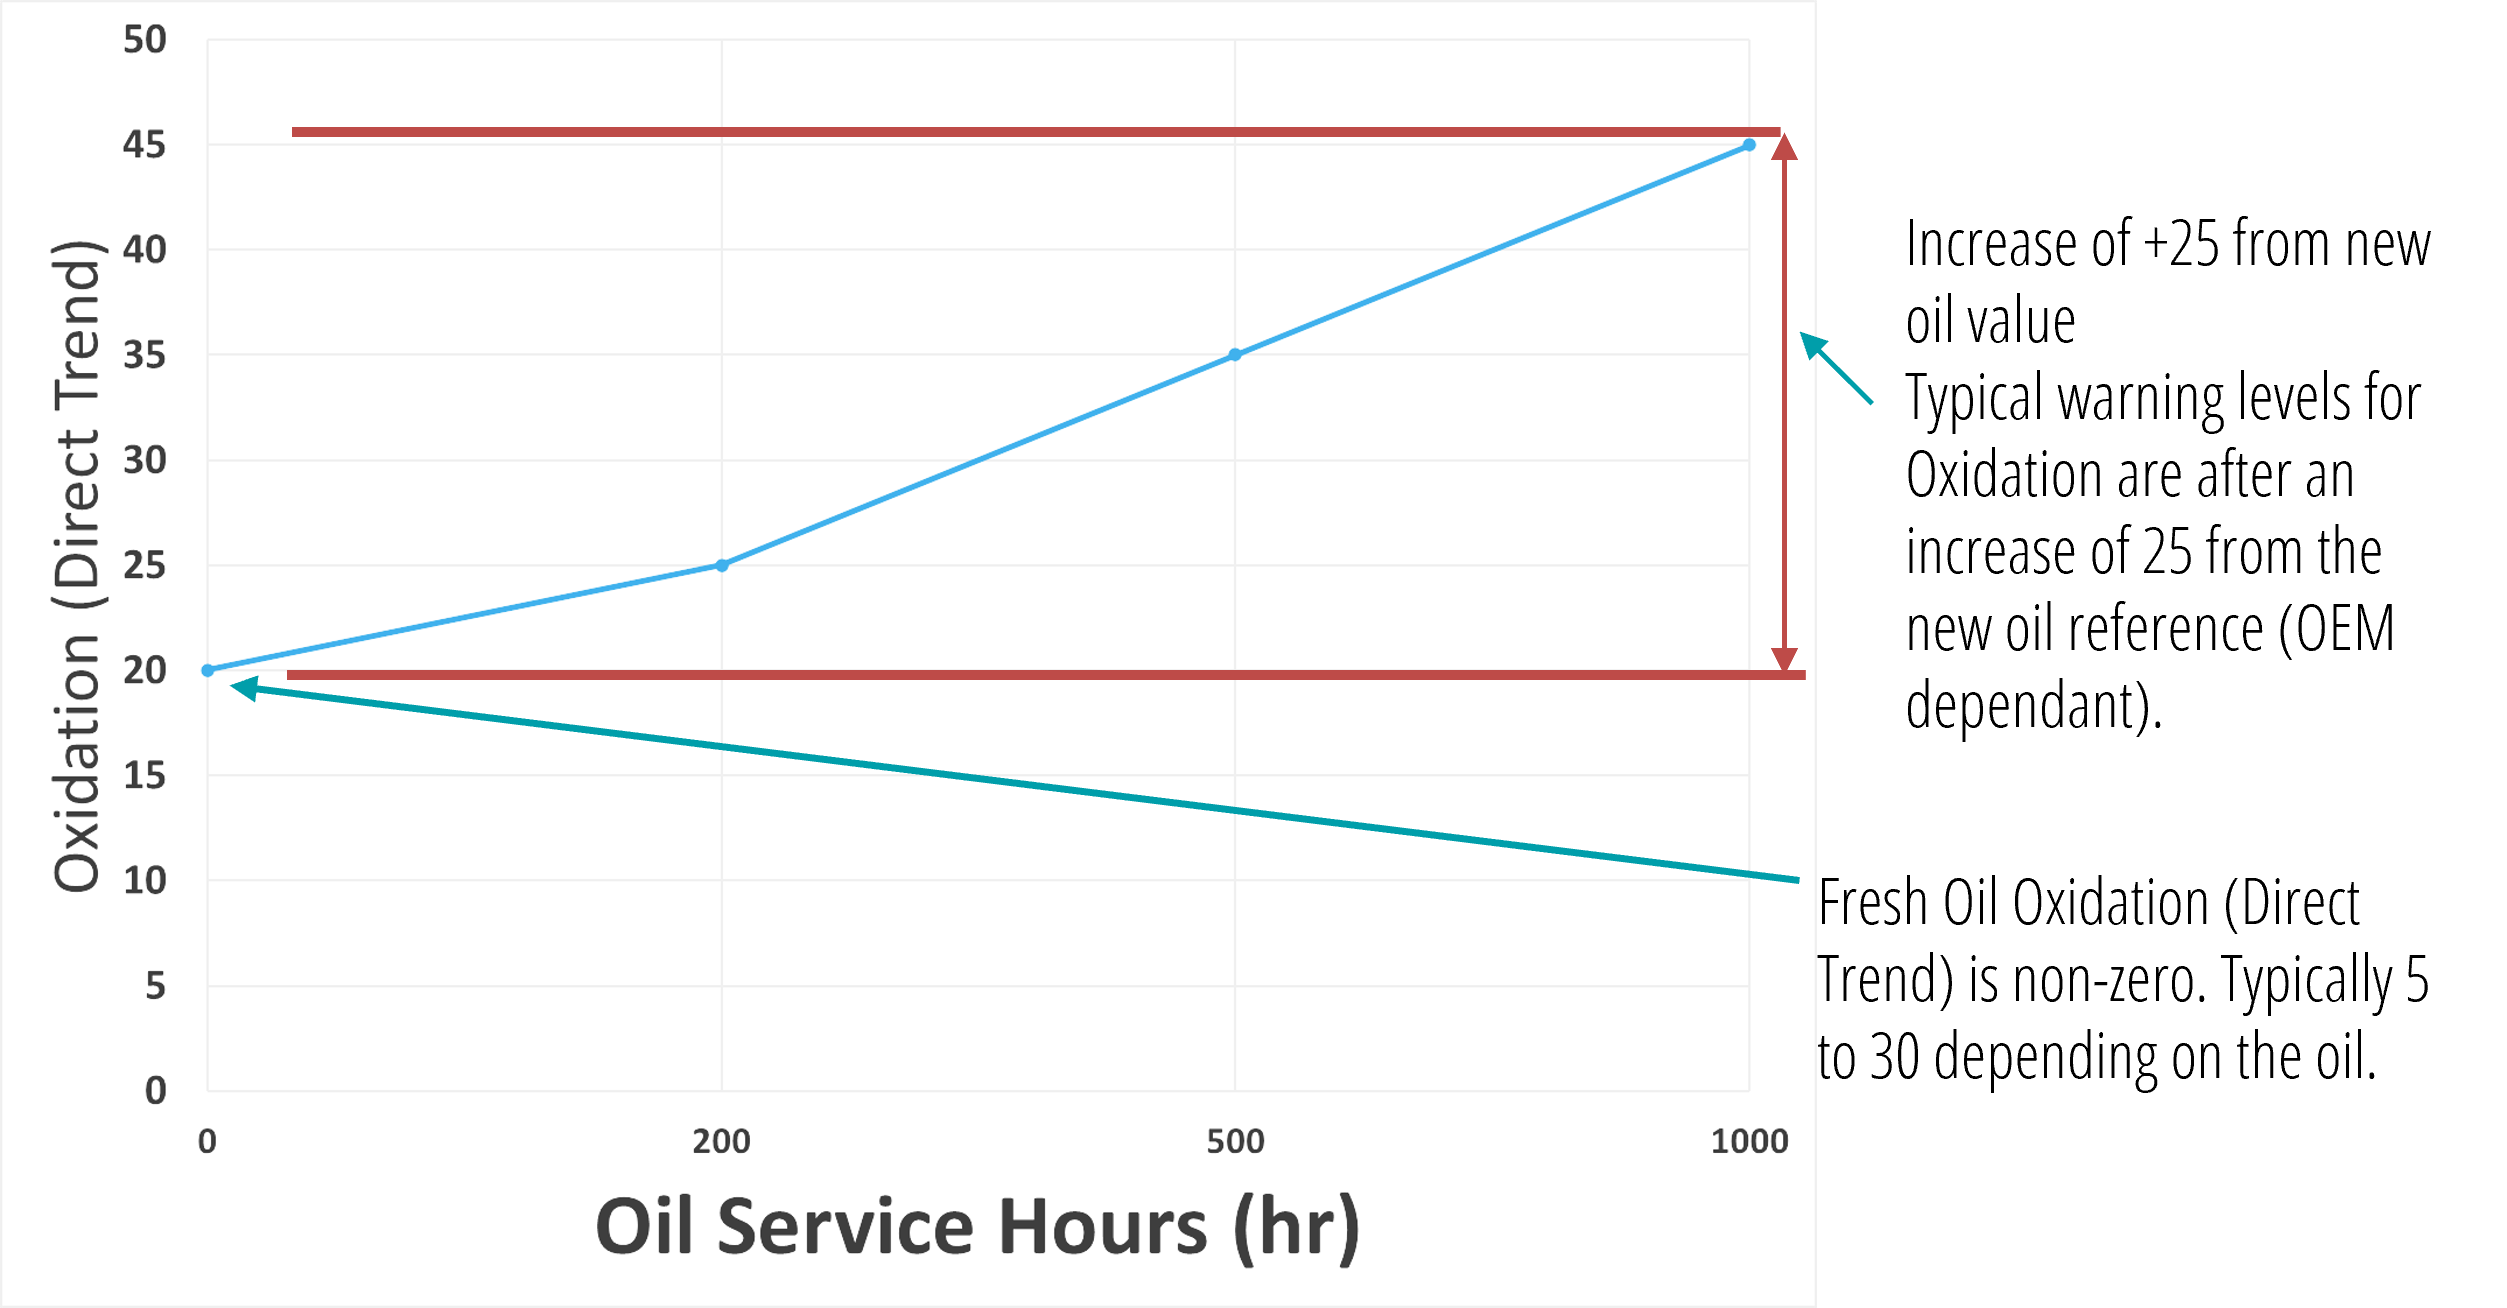
For the Spectral Subtraction methodology, alarm limits (flags) are based on component and oil-based statistical limits. New oils start at zero (0) and increase in value as the oil ages.
Direct Trend alarm limits are based on a difference from the new oil reference value. New oils have a reference value and increase over time. Trend plotting is used to identify changes.
FAQs
How will this affect my results?
When the change to FTIR Direct trend become effective you may notice a step change in your Oxidation, nitration or sulfation results. % Soot will not change. Fluid Life will update the flagging limits (alarm limits) and assign a new oil baseline reference if using a common oil type. After the initial step change, the results can be trend plotted or simply monitored for the appearance of flags (alarms).
Do I need to submit a fresh oil sample as a baseline reference?
Fluid Life has a large library of new oil reference samples and will attempt to find one that matches your specific oil type. If an exact match is not found the analysis will be performed but the results cannot be compared against the new oil baseline.
How does % Soot compare between the direct trend and the spectral subtraction method?
There will be no change. % soot is a calibrated value that is independent of the oil reference.
How do Oxidation, Nitration and Sulfation compare between the two methods?
It is not easy to compare spectral subtracted results (height) to direct trend results (area). The comparison is not a simple multiple and each oil brand has a different conversion. The direct trend results can be trended and compared to the baseline fresh oil results. Monitor the increase from the baseline. Fluid Life allows you to set custom flags (alarm limits) and trigger additional testing based up on the results. For example you can set an alarm limit for oxidation after an increase of 30 above the fresh oil baseline for a particular oil type and trigger additional magnetic iron testing or SEM analysis to check for signs of wear.
How will my flagging or alarm limits be affected?
Fluid Life will automatically adjust the alarm limits for most oil types to comply with OEM reference limits. If custom alarm limits are present they will be converted to use the new method.
What will my report look like?
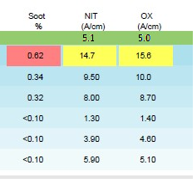
Example oil analysis report with a blank baseline for spectral subtracted FTIR results. The baseline is blank because the Spectral Subtraction method assumes the baseline for a new oil is zero.
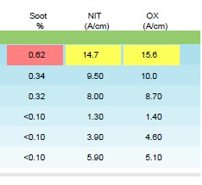
Example oil analysis report with baseline reference values for the Direct Trend methodology.